
Risk Data Visualisation
Advanced approaches to visualising complex risk information
The Challenge of Risk Complexity
In today's interconnected risk landscape, organisations face unprecedented complexity when trying to understand and communicate about risks. Traditional tables, heat maps, and static charts often fail to capture the multidimensional nature of modern risks.
At Risk Portal, we're pioneering new approaches to risk visualisation that help decision-makers grasp complex relationships, uncertainties, and dynamics that characterise the most important risks.
Beyond the Heat Map
Heat maps have dominated risk visualisation for decades, but they suffer from fundamental limitations: they flatten multidimensional information, hide uncertainty, and often create false precision.
Our advanced visualisation techniques incorporate uncertainty, temporal dynamics, and system interconnections to provide a more comprehensive view of your risk landscape.
Our Visualisation Approach
Our approach to risk visualisation is built on several key principles:
We design visualisations that explicitly show ranges of possibility, confidence intervals, and alternative scenarios, avoiding false precision.
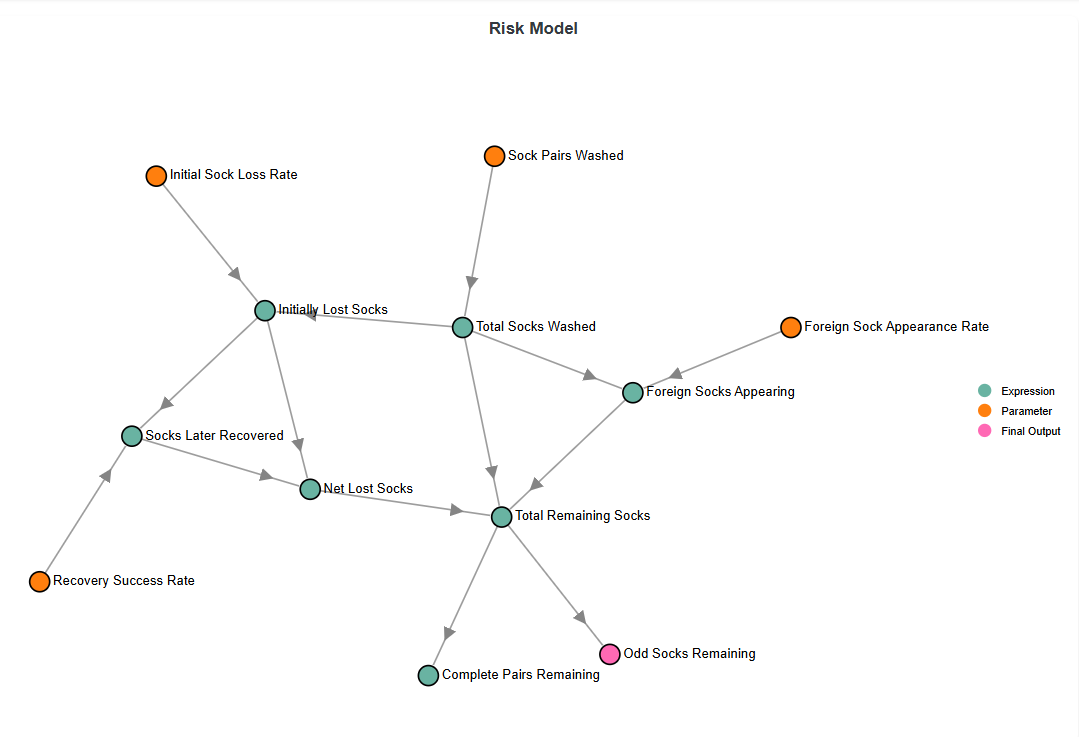
Our visualisations highlight connections between risks, showing causality, correlations, and feedback loops that drive system behaviour.
We create interfaces that allow users to explore risk data, test assumptions, and develop intuition about how risks might evolve.
Our visualisations combine quantitative information with qualitative context and narrative, helping users understand not just what might happen, but why.
Case Studies
Our risk visualisation work has helped organisations across sectors make better decisions under uncertainty:
Financial Services Stress Testing
We helped a major UK bank develop interactive visualisations of their stress testing results, allowing executives to understand complex scenarios and their implications for different business units.
Supply Chain Resilience
For a global manufacturer, we created network visualisations showing vulnerability points and cascade effects in their supply chain, leading to targeted resilience investments.
Emerging Risk Dashboard
Our emerging risk dashboard helps organisations track weak signals of change and visualise potential future risk landscapes, supporting proactive strategy development.