
MCMC Risk Dashboard
A sophisticated approach to analyzing, visualizing, and forecasting emerging technological risks
Introduction
The MCMC Risk Dashboard is a sophisticated tool for analyzing, visualizing, and forecasting emerging technological risks using probabilistic methods. This article explains what the dashboard does, how its components work together, and how they can be used to make better strategic decisions.
Dashboard Purpose
The MCMC Risk Dashboard helps organizations:
- Visualize complex relationships between different emerging risks
- Understand the uncertainty around risk levels using probability distributions
- Forecast how risks will evolve over time
- Analyze how different scenarios might impact risk profiles
- Identify effective interventions to reduce specific risks
Key Components and Their Functions
What it does:
Shows the interconnected nature of different risks as a network diagram.
Business value:
Reveals how risks influence each other, helping identify which risks act as "drivers" or "amplifiers" for others.
What it does:
Displays a probability distribution showing the range of possible risk levels based on current evidence and relationships.
Business value:
Provides a nuanced view of risk that goes beyond simple point estimates, showing uncertainty and likelihood of different outcomes.
What it does:
Projects how risk levels may change over time, showing both expected trajectory and uncertainty ranges.
Business value:
Enables proactive planning by anticipating how risks might evolve before they become critical.
What it does:
Analyzes how different risks influence each other and shows the probability relationships between them.
Business value:
Identifies key dependencies and potential cascade effects between risks.
What it does:
Models how specific future scenarios (like "Quantum Computing Breakthrough" or "Regulatory Controls") would affect risk projections.
Business value:
Enables "what-if" planning for major industry or technology shifts.
What it does:
Assesses the potential effectiveness of specific risk mitigation actions.
Business value:
Helps prioritize limited resources by focusing on interventions with the highest expected impact.
How These Components Work Together
The dashboard creates an integrated risk analysis experience:
- Start with the network view to understand how risks relate to each other
- Examine the posterior distribution for the specific risk you're concerned about
- Check the evolution forecast to see how this risk might change over time
- Use conditional influence analysis to identify which other risks most strongly affect your target risk
- Explore scenarios to understand how external events might change your risk profile
- Evaluate interventions to determine the most effective risk reduction strategies
Simulation Parameters
The dashboard allows adjustment of simulation parameters that affect the analysis quality:
- Iterations: How many samples are generated (higher = more precise but slower)
- Burn-in Period: Technical parameter to ensure statistical validity
- Number of Chains: Controls the reliability of the analysis (more chains = better validation)
- High Risk Threshold: The level at which a risk is considered significant (typically 0.7)
Example Analysis Workflow
- Select a risk from the risk dropdown to focus analysis
- Review the network visualization to see relationships and influences
- Check the posterior distribution showing expected risk levels
- Examine the evolution forecast indicating how risk might change over time
- Review conditional dependencies revealing strong influences between risks
- Compare scenarios to understand potential impacts of external events
- Evaluate interventions to identify the most effective actions
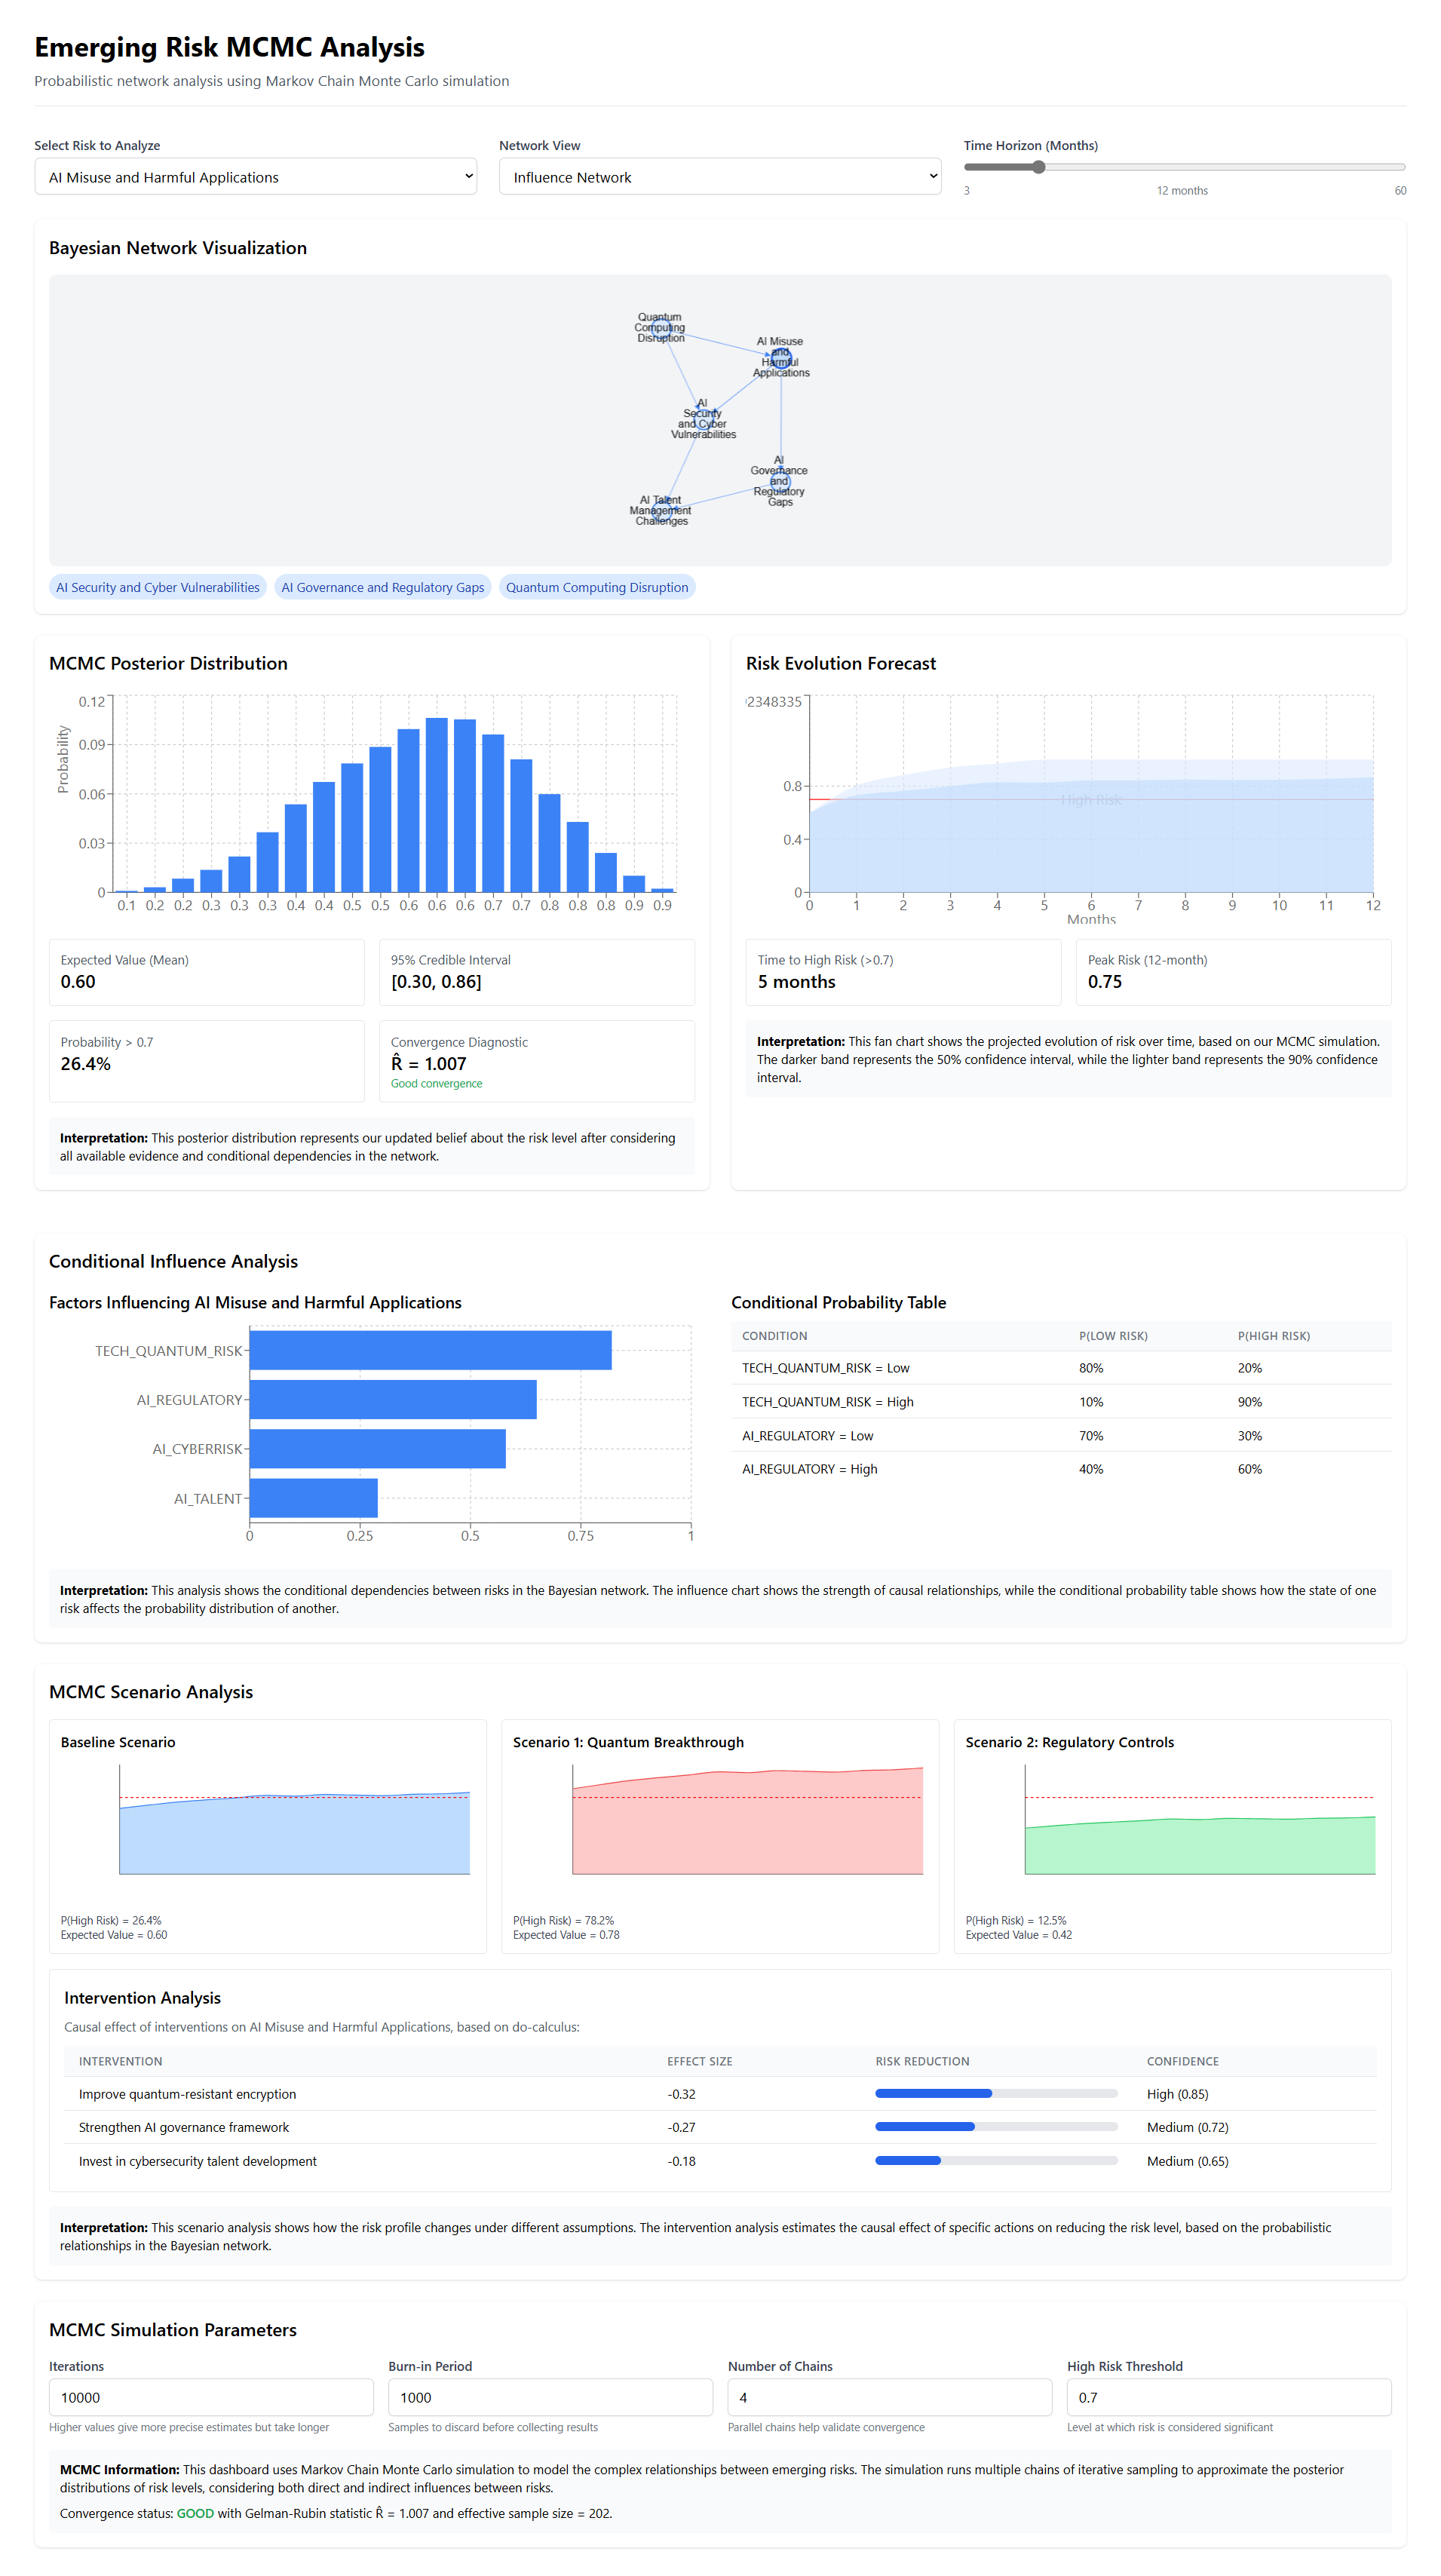
MCMC dashboard showing relationships between different risk factors
Business Benefits
Gain a comprehensive view of the interconnected risk landscape, understanding how different risks influence and amplify one another.
Move beyond backward-looking metrics to anticipate how risks will evolve over time, enabling proactive rather than reactive risk management.
Embrace uncertainty with probability distributions rather than point estimates, leading to more nuanced risk assessments and decision-making.
Test different future scenarios to better prepare for major industry or technology shifts, building organizational resilience to changing conditions.
Focus limited resources on mitigation actions with the highest expected impact, maximizing the effectiveness of risk management investments.
Establish a shared language and methodology for discussing risks across the organization, improving communication and collaboration.
Transform Your Approach to Risk Management
By using this dashboard, risk managers, executives, and board members can develop a more sophisticated and nuanced understanding of emerging technological risks, leading to better strategic decisions and more effective risk management.